Microsoft PowerBI
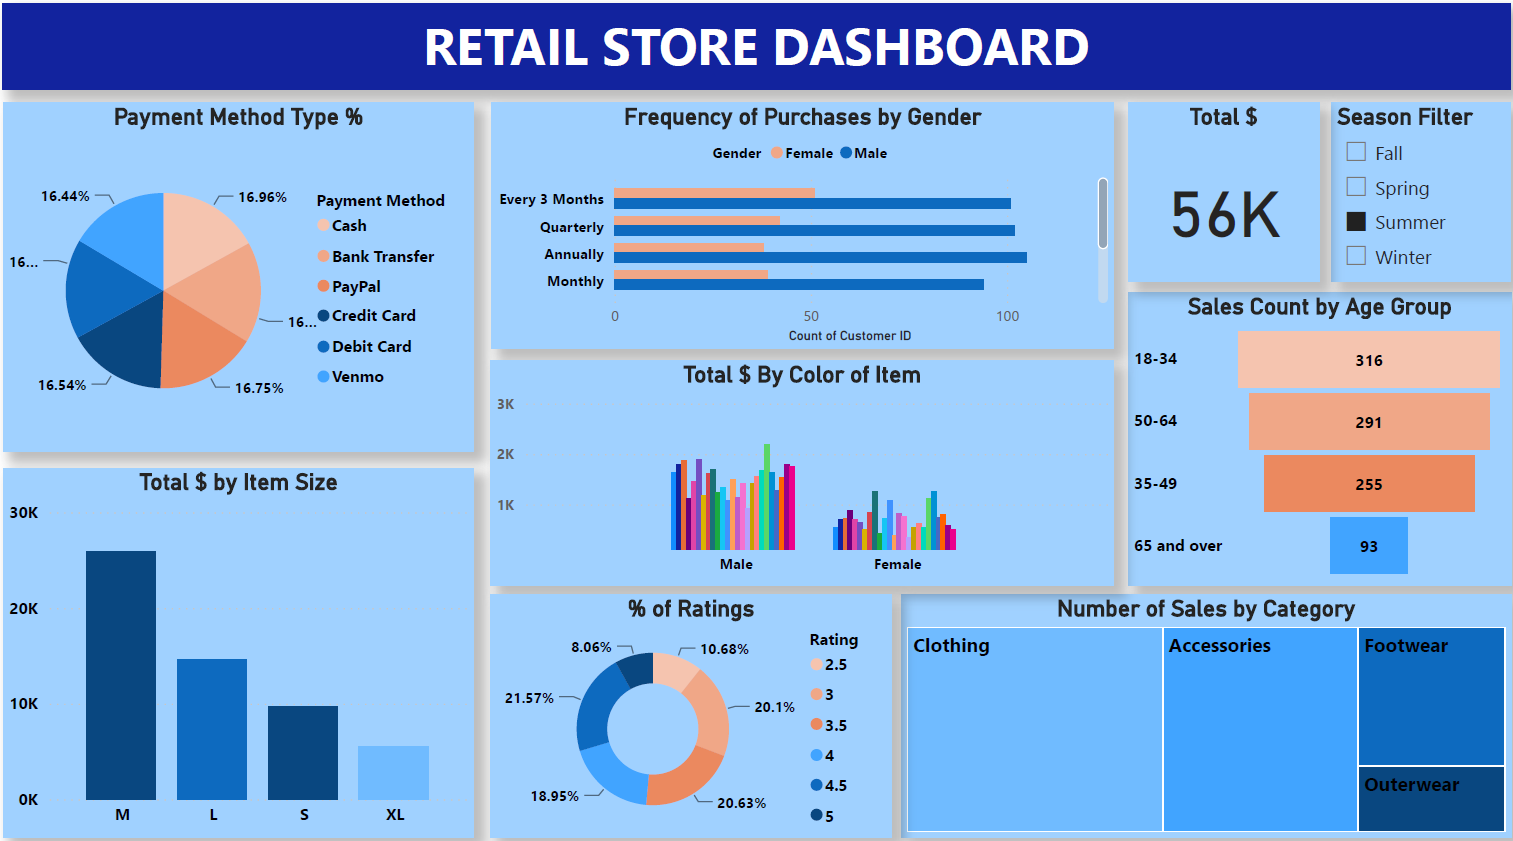
Microsoft Power BI is a powerful tool because it allows users to easily visualize and analyze complex data from various sources, enabling informed decision-making through the use and integration of the Microsoft stack. In this example, I'll showcase a snapshot of a static dashboard report.
Heres three reason I love dashboards. One, it allows the use of different visuals that are relative to the dataset and so you are easily able to understand data at a glance. Two, through the use of filters in allows you to play around with data. Three, well, it just looks pretty.
Using descriptive statistics to make sense of things
This simple family of statistics, are usually the backbone of many analyses, offering invaluable insights into patterns and in this case, customer behavior. By analyzing measures like average sales and popular product purchases, we gain a deeper understanding of market trends and what customers wants.
For this specific use case, just at a glance we can quickly see three insights. One, our shoppers generally belong to the younger crowd. Two, medium clothing significantly contributes, more than other sizes, to the sales. Three, males almost buy double the amount of clothing than females do at this shop. So, with this information, what decisions moving forward would you make?