Python
For this project I used a data set that comprised of the weather recording for each day over the span of one year. To analyse the data, I used a cool statistical library called Sci-Kit, which consists of many useful statistical techniques. My chosen approach to this project was conducting a random forest analysis.
A random forest analysis is like a group decision-making processes where a large number of individual opinions are combined to make a final decision. Imagine you have a complex question and you ask many people for their opinion. Each person has their own perspective and expertise, and they may come up with different answers. In a random forest, each "person" represents a decision tree—a simple model that tries to answer the question based on different factors. The random forest algorithm combines the opinions of all these decision trees to make a more accurate and reliable prediction. By considering a diverse range of viewpoints and averaging out individual biases, random forests are incredibly powerful tools for solving complex problems, such as predicting customer preferences or diagnosing diseases, with remarkable accuracy. We'll keep things simple for this project, and stick to trying to predicting the weather.
Once the data is processed appropiately, i.e. the data is cleaned, handled, validated and accuracy has been assessed, we are ready to apply our algorithm to the data.
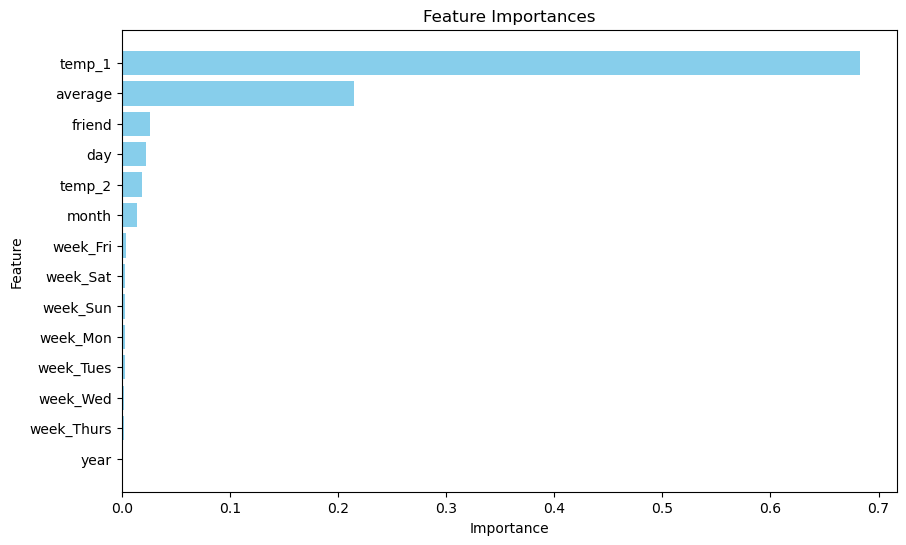
The results of our analysis indicated that I was able to develop a robust model that was capable of predicting the weather with 82% accuracy. Hmm, not too bad, I do believe with some tuning we may be able to improve this number, but nonetheless. Below you'll find a bar chart that lists the 'importance' of each feature (these were the columns in the dataset, we could call them variables as well) in predicting the tempreture. Remarkably, the temp 1 (recording of weather station 1) had a higher importance as opposed to the average temp (the average between temp 1 and temp 2), indicating that weather station 1 generally reads the tempreture with higher accuracy.
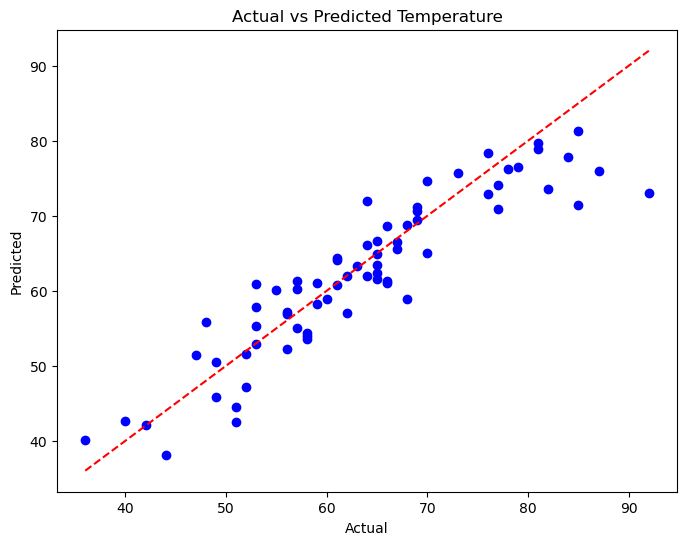
The scatter plot below compares actual versus predicted temperatures generated by a random forest predictive model and provides a visual representation of how well the model performs in forecasting temperatures. Each point on the plot represents a specific instance where the temperature was predicted by the model and the actual temperature observed. Ideally, if the model's predictions are accurate, the points should align closely along a diagonal line from the bottom-left corner to the top-right corner of the plot, indicating a strong correlation between the predicted and actual values. Deviations from this diagonal line suggest discrepancies between predicted and actual temperatures, providing insights into areas where the model may need improvement or further refinement.
If this model was to be taken a step further we could deploy the model. As our model is trained and has been evaluated satisfactorily, we could deploy it into a production environment where it can make real-time predictions. This may involve integrating the model into existing or new weather forecasting systems, websites, or mobile applications. The model takes input data such as current weather conditions and predicts future weather outcomes.
The Power of Predictive Models in the Real World
Predictive models can seriously revolutionize decision-making in the people, organisations, cities, and countries in the real world. By forecasting future outcomes based on historical data and patterns, where details are analysed from predicting customer behavior and preferences to anticipating market trends and demand, these models enable us to make informed and strategic decisions, allocate resources efficiently, and mitigate risks effectively. In healthcare, predictive models can aid in early disease detection and personalized treatment plans, ultimately saving lives. In finance, they can help identify fraudulent activities and optimize investment strategies, or like in this project, whether or not to wear a jacket.